

One of ValGenesis specialities is the digitalization of the Continued Verification Process (CPV).
We consider it a game-changer for the pharmaceutical manufacturing industry because:
- It’s swift to implement, you can use a simple workflow for many products.
- It’s automated, it integrates all your systems for collection, analysis and storage of data.
- It’s online, which allows you to check your process status in real-time through dashboards.
- It allows you to accelerate and automate report generation without human input.
These are great advantages, but what if we told you, step-by-step, what are the real benefits based on the experience of our customers? Let’s take a look!
What’s the Starting Point?
For this case study, we’re considering the following manual CPV starting point:
- The team spends approximately 1 day and a half per week collecting and compiling data and plotting charts.
- This team includes people involved in the process of data collection and chart execution and people reviewing and building reports, making it a labor-intensive process with more than 10 people involved. The team performs these tasks sequentially:
- They start by manually extracting the data from the information systems such as LIMS or SAP to an Excel file – input and copy and paste.
- Then, they go ahead and organize the data for each Critical Quality Attribute (CQA) and critical process parameters (CPP) in chronological order. If the CPV is being set up for the first time, the team also needs to select the reference batches in the Excel file. This may be one of the lengthiest parts of the process.
- From there, they start to organize the data and transpose it from the Excel file into a statistical management software to prepare the charts.
- Lastly, they compile the charts in a Word document alongside a discussion of the data analyzed.
Does any part of this process sound familiar to you?
What Are the Current Issues?
The manual set-up of a CPV plan is crowded with challenges, some of which I am sure you’re familiar with:
- There’s a high risk of data integrity failures.
- The process is highly dependent on manual activities, which means that the absence of a team member will be a cause for delays.
- You lose the ability to act proactively in your process, putting at risk the state of control of your process and the quality of your final product.
- Too much effort is put into compiling the data, generating statistical charts and creating the reports instead of analyzing the data and implementing improvement actions.
Establishing the Goals for the Digital Cpv Implementation
The first step towards implementing a Digital CPV is to define the goals. Our approach focuses on targeting the following:
- Ensure compliance with guidelines and recommendations (GAMP 5, FDA’s Process Validation, PDA’s TR 60 and any other local requirements).
- Ensure Data Integrity.
- Streamline the implementation of CPV plans for a large number of products through a simple, robust and repeatable workflow.
- Be able to check the state of the process at any time, anywhere.
- Integrate systems of data acquisition and storage.
- Accelerate periodic reporting.
Implementing the Digital CPV
Once the goals are defined, we design the steps that support the implementation of a regulatory-compliant Digital CPV.
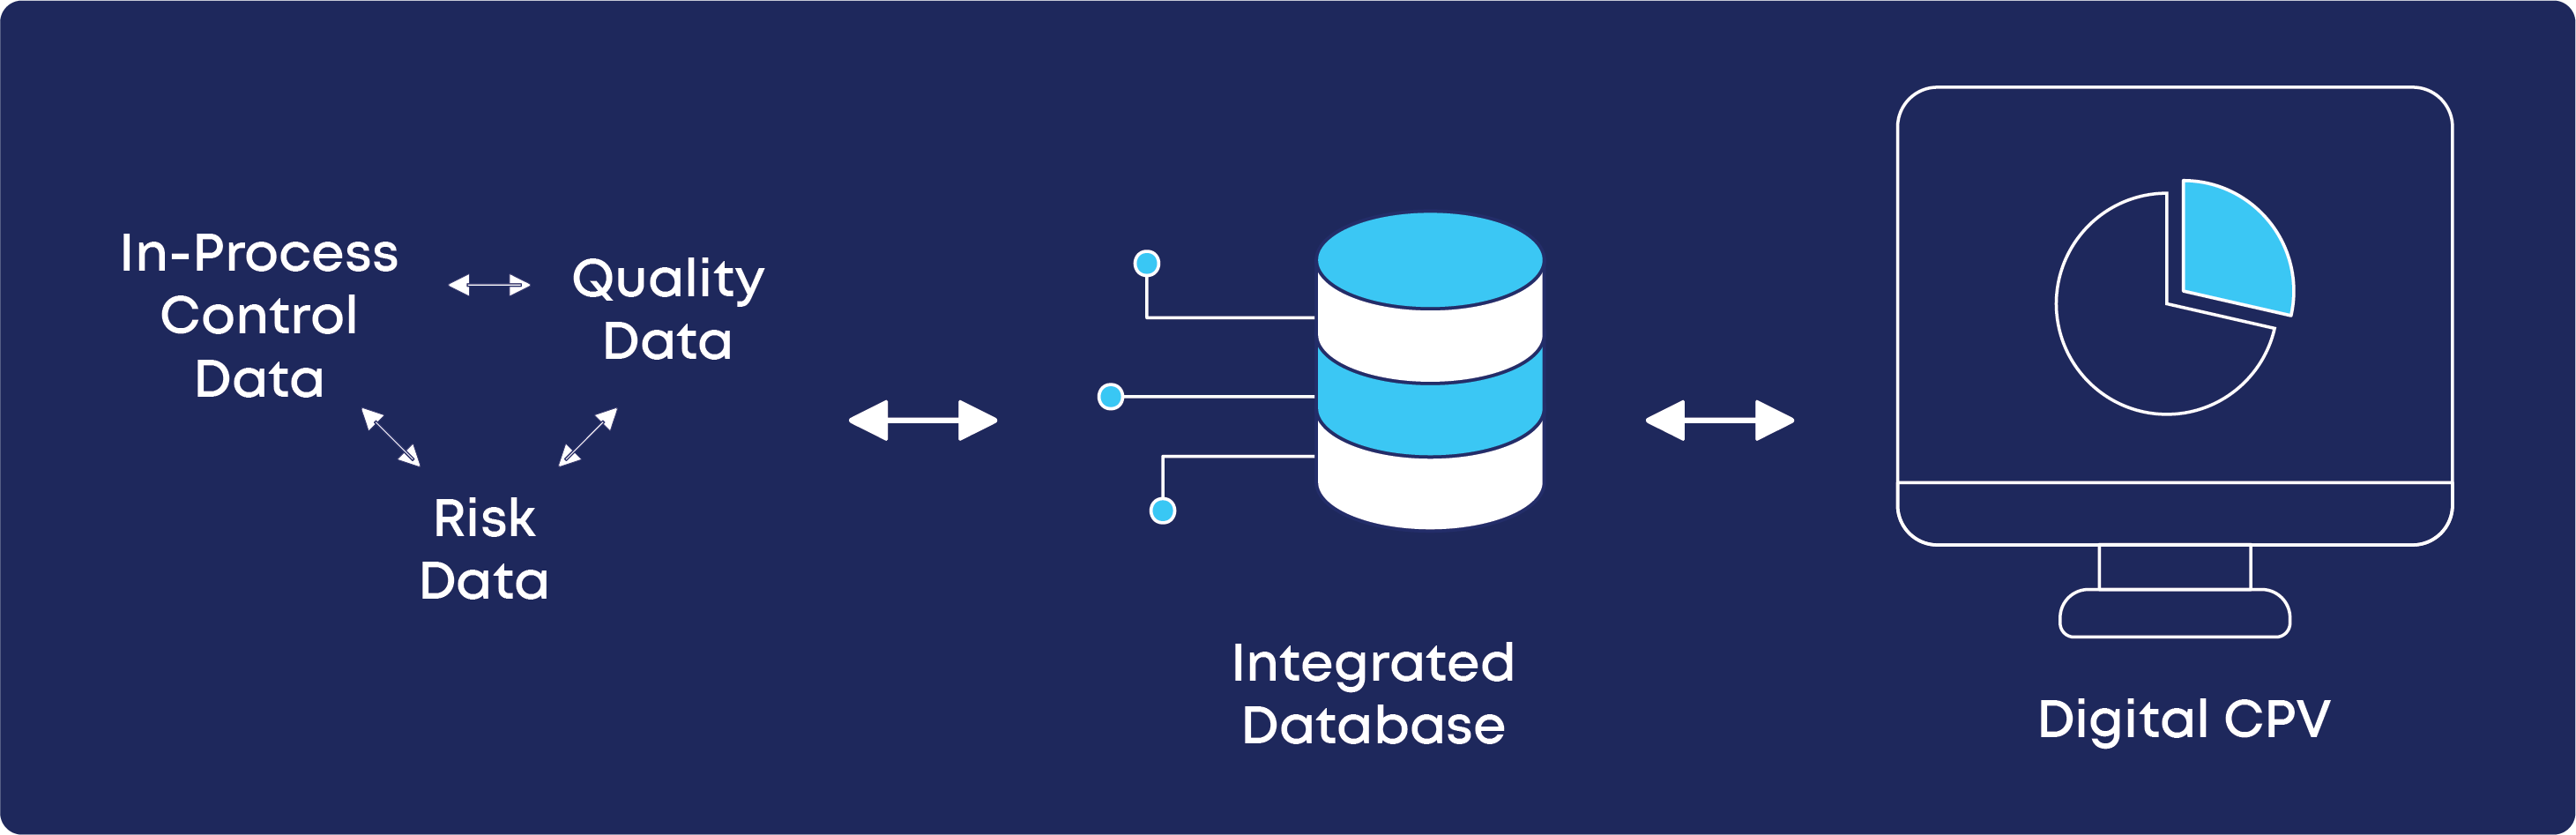
One of the key steps is to integrate the data systems, where the pharmaceutical company’s sources of data are integrated into the Digital CPV database itself. This will enable the automatic, real-time monitoring.
A specialized training should be given to the team and Standard Operating Procedure (SOP) should be prepared.
Lastly, one should define the pilot environment testing. Here the process, quality and risk data are aggregated into a database which will work as the data source for the digital CPV platform.
What Were the Practical Outcomes of the Digital CPV Implementation?
The first benefit that you notice is a boost in efficiency and ease of visualizing, understanding and analysing data.
Another benefit is the possibility of implementing automatic alarms that make sure that you are aware if any of the critical process variables and / or quality attributes are trending out of their established limits.
The third benefit is a substantial reduction in workforce and time invested in report preparation because you can just prepare the report templates and schedule their automatic generation with all the information.
The last major practical outcome is guaranteeing data integrity. You start by removing any errors related to data input as well as the need to validate said input. Duplicated data problems and their cleanup also disappear. Moreover, it automatically builds your audit trail to make sure you’re always protected.
What Does Preparing a CPV Plan With a Digital CPV Look Like?
We briefly discussed the implementation of a digital CPV but we haven’t told you how it looks like to prepare a CPV Plan using a Digital CPV. It consists of a few steps:
Risk Assessment
You start by performing a risk assessment in order to identify the Critical Process Parameters (CPPs) and the Critical Quality Attributes (CQAs).
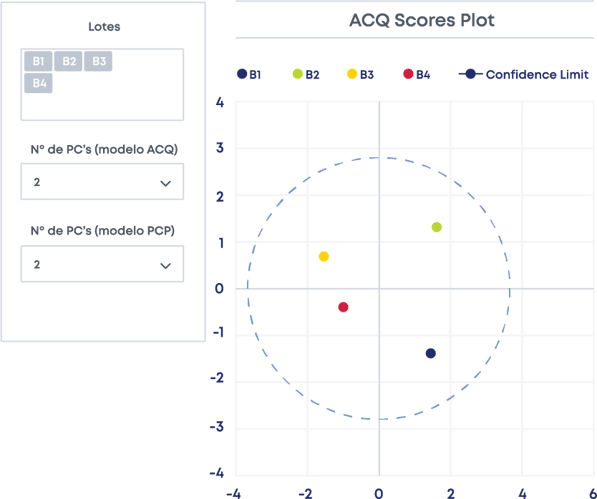
Selecting the Reference Batch
The next step is selecting the reference batch. It is selected by analysing every critical attribute data simultaneously using multivariate analysis (MVDA). This allows you to define the design space based on the batches you selected as reference batches.
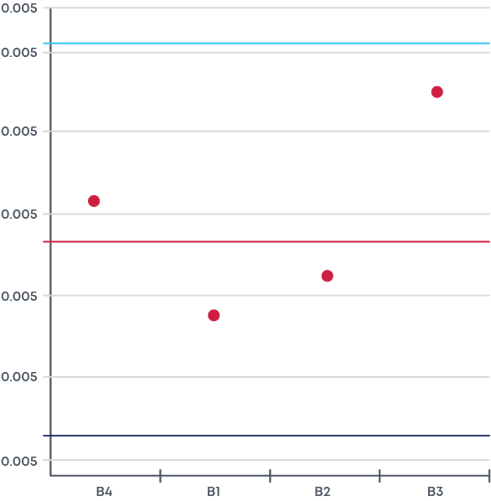
Defining the Chart Limits for the CPPs and CQAs
Here you define the statistical parameters (Process Capability Index [CpK], normality testing parameters, control limits) for each one of the CPPs and the corresponding process control limits in alignment with your control strategy.
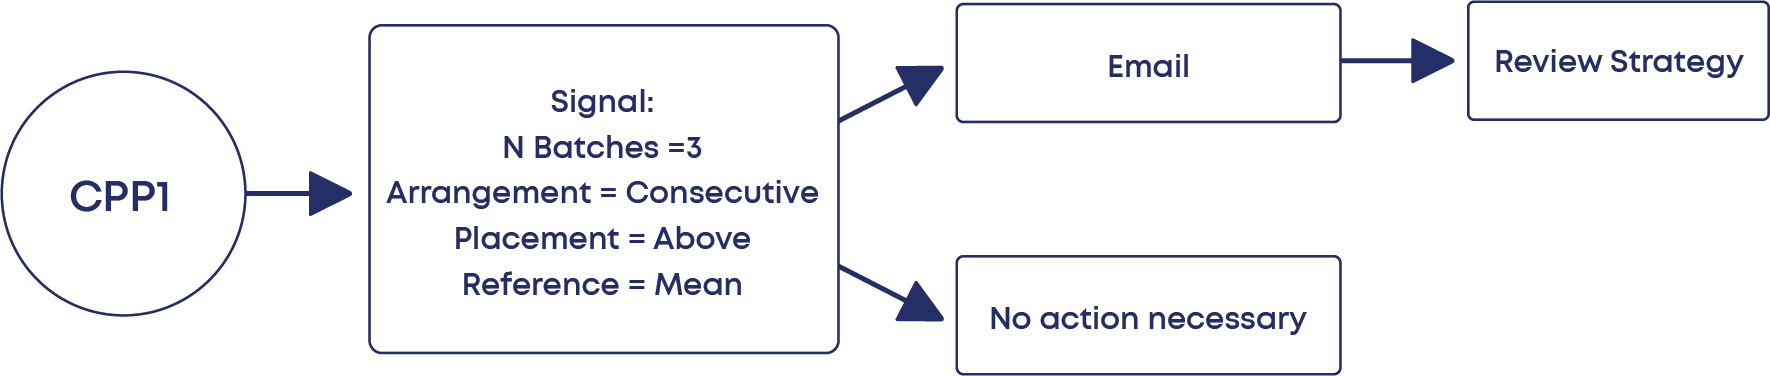
Setting Response Signals
The last step consists of configuring the statistical signals (with Westgard Rules, for example) that can be automatically triggered during the routine CPV.
This means that, if any of the signals is triggered, the affected batches will be highlighted, and the responsible users immediately notified.
And that’s it! Your CPV plan is configured and ready to operate autonomously.
What About Real-Time Monitoring?
Another major benefit of the Digital CPV is your ability to check product data at any time through routine monitoring panels. The interface with the user can be in the format of a PCA plot, control chart or CpK /PpK plots, just to name a few.
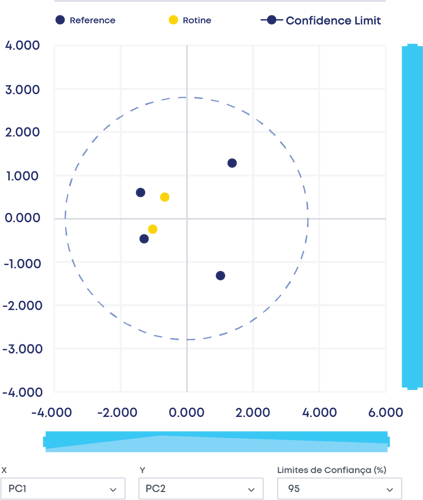
Figure 1 - Multivariate CQA Analysis
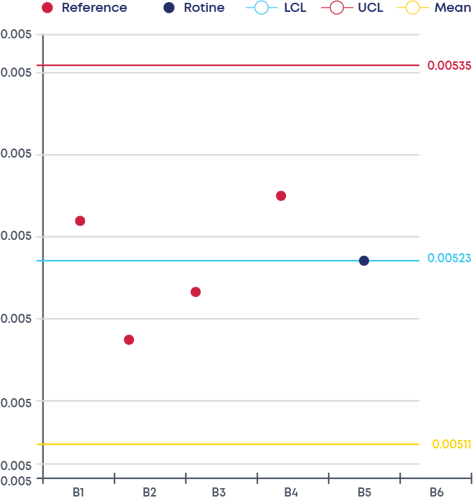
Figure 2 - Control chart
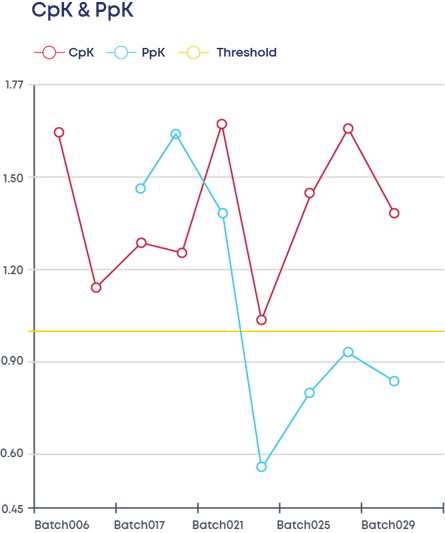
Figure 3 - CpK and PpKs
How Does It Look Like When Compared to the Starting Point?
The best part about implementing a digital CPV is observing its outcomes.
For the presented case study, a very evident outcome was the substantial reduction in the necessary workforce: We started with more than 10 people, and the Digital CPV implementation reduced the team in about 70%.
These team members are now available to dedicate themselves to do research on improvement opportunities based on the data they don’t have to gather anymore.
While with the manual CPV, a day and a half per week was necessary to put together the reports, the system now performs that task automatically.
Last, but not the least, the data integrity risks disappeared.
ValGenesis Can Support Your Digital Cpv Implementation
ValGenesis has the best Digital CPV solution in the market: Process Insight.
Our team of experts will walk you through the steps identified in this case-study to make sure you reap all the possible benefits from CPV digitalization.
Table of Contents
Related Blog Posts